Electromagnetic wavelengths run from femtometers to kilometers, more than twenty orders of magnitude. The core design problem in this explorer was making that entire range navigable on a single screen, which is why everything in the interface, from the spectrum bar to the position marker, is built on logarithmic scaling.
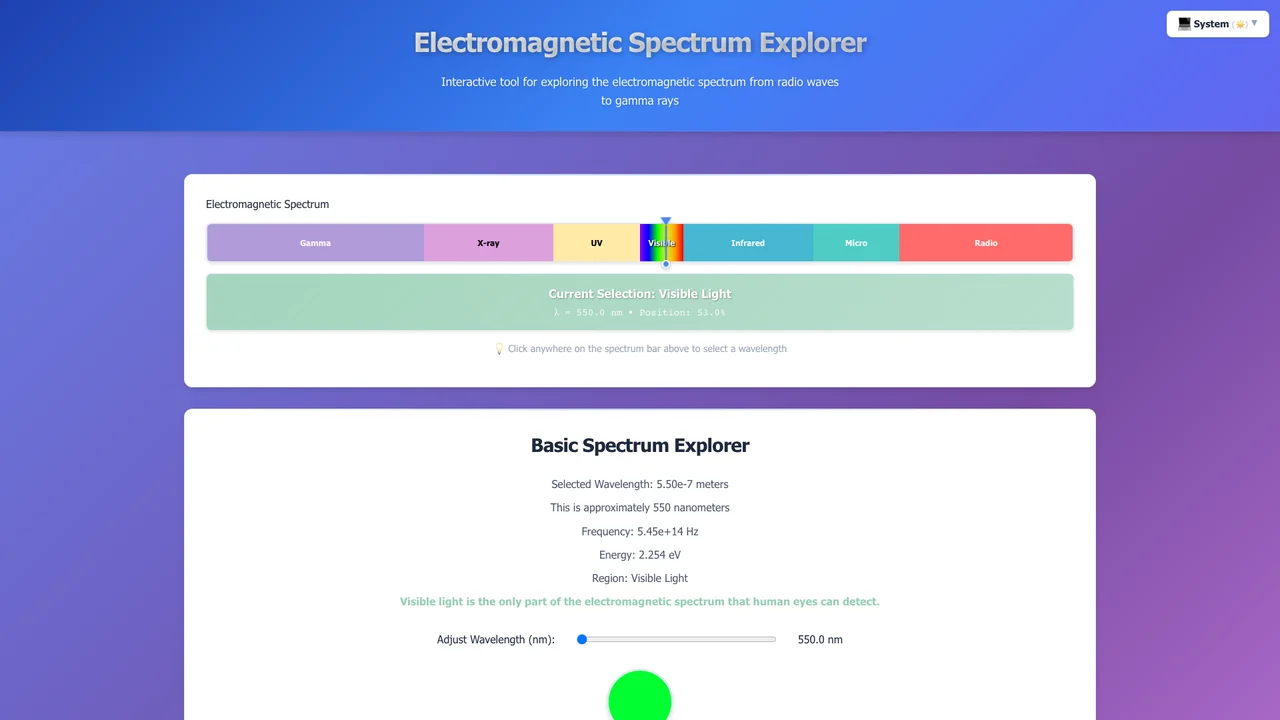
Spectrum Explorer
Frequency: 430-750 THz
Energy: 1.7-3.1 eV
The only portion of the spectrum visible to human eyes.
Key Features
- Full Spectrum Coverage: From radio waves to gamma rays
- Real-Time Visualization: Interactive spectrum display with logarithmic scaling
- Unit Conversion: Convert between wavelength, frequency, and energy
- Educational Content: Details for each band
- Scientific Accuracy: NIST-certified physical constants
Technical Implementation
The physics calculations build on a small set of fixed constants:
export const PHYSICS_CONSTANTS = {
  SPEED_OF_LIGHT: 299792458, // m/s (exact)
  PLANCK_CONSTANT: 6.62607015e-34, // J*s (exact)
  PLANCK_CONSTANT_EV: 4.135667696e-15, // eV*s
};

export function wavelengthToFrequency(wavelength) {
  return SPEED_OF_LIGHT / wavelength;
}
Log scaling is what keeps the whole range usable in one view, from femtometers up to kilometers.
What was hard
Scientific tools punish sloppy numerics. Values near the edges of the spectrum push against JavaScript’s floating-point limits, so every calculation validates its inputs and returns NaN early rather than letting a bad value propagate through a chain of conversions into a plausible-looking wrong answer. The conversion panel was the other challenge: wavelength, frequency, and energy are three views of one quantity, so editing any field has to update the other two without triggering an infinite update loop. Input parsing also has to meet users where they are, accepting 550 nm, 5.45e14, or bare meters and normalizing the units before any math runs.
Was this helpful?
Want to learn more?
Ask can answer questions about this project's implementation, technologies, and more.