I built an interactive explorer for the electromagnetic spectrum. The web stack is ordinary: React and D3. The hard part was fitting a range that runs from femtometers to kilometers onto a single screen without lying about the scale or the physics behind it.
The Educational Challenge of Electromagnetic Radiation
The spectrum is a first-year physics staple, and it’s still hard to picture. Wavelengths run from femtometers to kilometers; frequencies run from kilohertz to zettahertz. A textbook diagram flattens all of that into a handful of evenly spaced bands, which hides the logarithmic relationships and says nothing about where any of it turns up in daily life.
So the interface has to stay accurate while still being easy to poke at. Someone using it should walk away with the math linking wavelength, frequency, and energy, plus a feel for where those numbers land in practice, from medical imaging to radio communications.
Scientific Accuracy Requirements
A teaching tool that gets the numbers wrong is worse than none. I used the exact constants NIST publishes and carried their full precision through every calculation:
export const PHYSICS_CONSTANTS = {
  SPEED_OF_LIGHT: 299792458, // m/s (exact)
  PLANCK_CONSTANT: 6.62607015e-34, // J⋅s (exact)
  PLANCK_CONSTANT_EV: 4.135667696e-15, // eV⋅s (exact)
  ELECTRON_VOLT: 1.602176634e-19, // J (exact NIST 2018 value)
};
Every other value in the app is derived from these, so getting them right once keeps the rest of it honest.
Architecture Patterns for Scientific Visualization
Physics Calculation Engine
Every value on screen is derived from a wavelength, which puts the conversion functions at the center of the whole thing. They have to cover the full range without choking on bad input:
export function wavelengthToFrequency(wavelength) {
  if (!isFinite(wavelength) || wavelength <= 0) return NaN;
  return SPEED_OF_LIGHT / wavelength;
}

export function wavelengthToEnergyEV(wavelength) {
  if (!isFinite(wavelength) || wavelength <= 0) return NaN;
  return (PLANCK_CONSTANT_EV * SPEED_OF_LIGHT) / wavelength;
}
Note the guard on the first line of each. A zero or negative wavelength is meaningless, and worse, it produces a plausible-looking wrong number once it flows through a chain of conversions. Returning NaN early kills it at the source.
Logarithmic Scale Visualization
Electromagnetic spectrum visualization requires logarithmic scaling to represent the enormous range of wavelengths and frequencies. The implementation uses D3.js scaling functions combined with custom positioning algorithms:
export function getLogPosition(value, min, max) {
  if (value <= 0 || min <= 0 || max <= 0) return 0;
  const logValue = Math.log10(value);
  const logMin = Math.log10(min);
  const logMax = Math.log10(max);
  return (logValue - logMin) / (logMax - logMin);
}
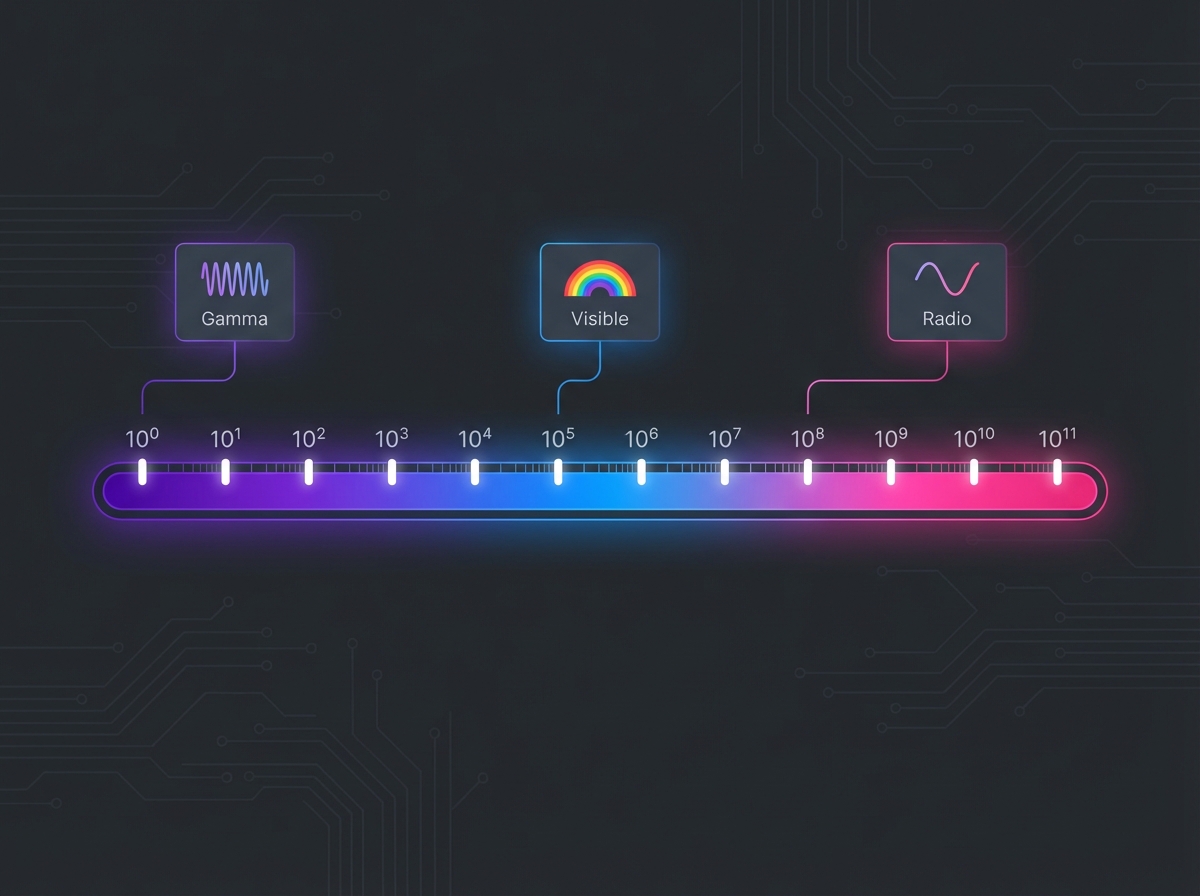
That normalizes any value to a position between 0 and 1, which is what lets a single bar hold 20+ orders of magnitude, from gamma rays in femtometers to radio waves in kilometers.
Data Architecture for Spectrum Regions
Structured Spectrum Data
Each region of the spectrum is a plain object that carries its own boundaries, a color, and the human-readable content that goes with it:
export const SPECTRUM_REGIONS = [
  {
    id: 'gamma',
    name: 'Gamma Rays',
    color: '#B19CD9',
    wavelengthMin: 1e-15, // 1 fm
    wavelengthMax: 10e-12, // 10 pm
    frequencyMin: 3e19, // 30 EHz
    frequencyMax: 3e23, // 300 ZHz
    energyMin: 124000, // eV (124 keV)
    energyMax: 1e12, // eV (1 TeV)
    description: 'Gamma rays are the most energetic form of electromagnetic radiation.',
    applications: [
      'Cancer treatment (radiotherapy)',
      'Medical imaging (PET scans)',
      'Nuclear medicine'
    ],
    examples: [
      'Cobalt-60 therapy: 1.17 and 1.33 MeV',
      'PET scan tracers: 511 keV'
    ]
  }
  // ... additional regions
];
Keeping the numeric bounds and the descriptive text in one record means a lookup by wavelength hands back the region and everything I need to render its panel. No second join, no separate content file drifting out of sync.
Region Detection Algorithms
Finding the region for a given wavelength is a linear scan behind the same input guard as before:
export function getRegionByWavelength(wavelength) {
  if (!isFinite(wavelength) || wavelength <= 0) {
    return null;
  }

  return SPECTRUM_REGIONS.find(region =>
    wavelength >= region.wavelengthMin && wavelength <= region.wavelengthMax
  ) || null;
}
There are only a handful of regions, so a linear find is plenty. I’d rather keep it obvious than shave microseconds off a loop that runs once per click.
Interactive Conversion Interface Design
Real-time Unit Conversion
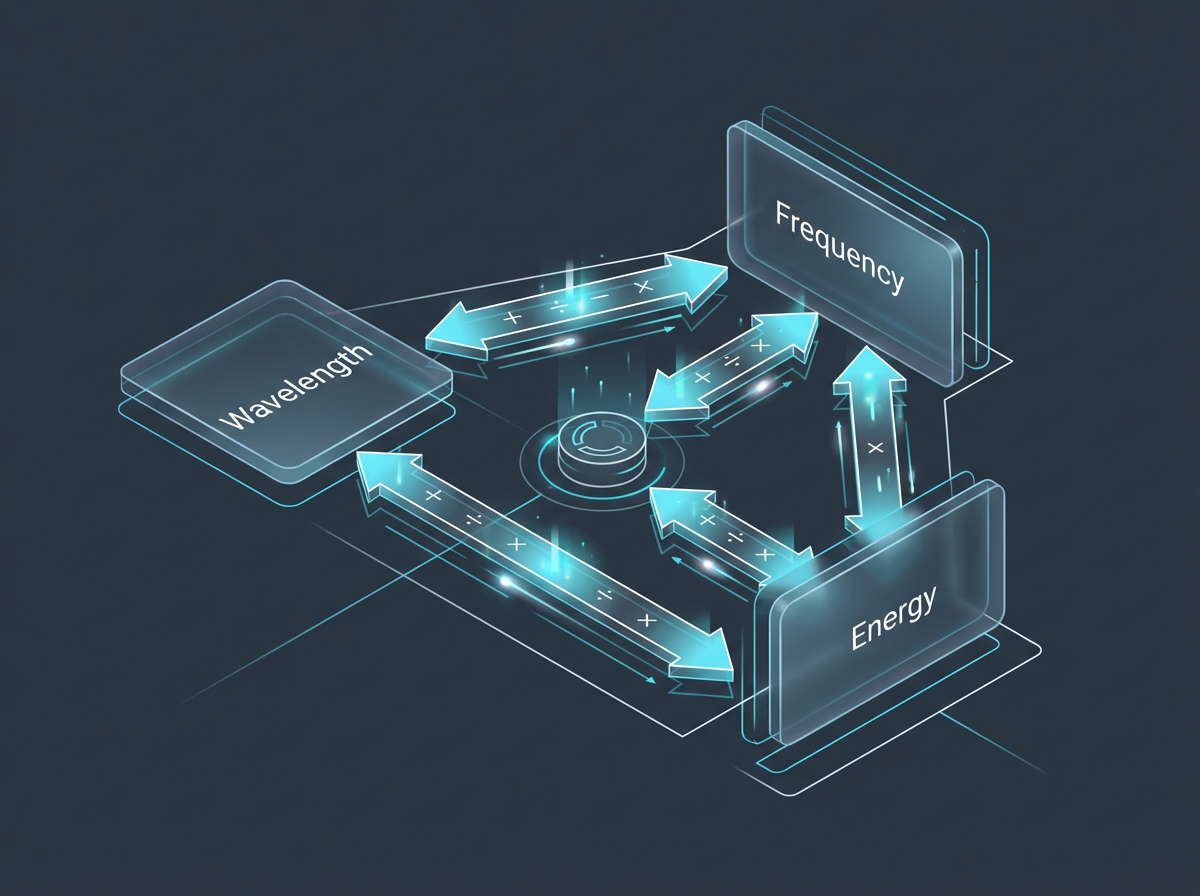
The conversion panel has three inputs (wavelength, frequency, energy) that all describe the same photon. Change one and the other two should follow:
function SimpleConversionPanel({ selectedWavelength, onWavelengthChange }) {
  const [wavelengthInput, setWavelengthInput] = useState('');
  const [frequencyInput, setFrequencyInput] = useState('');
  const [energyInput, setEnergyInput] = useState('');

  const handleWavelengthChange = (value) => {
    const wavelength = parseWavelength(value);
    if (!isNaN(wavelength) && wavelength > 0) {
      onWavelengthChange(wavelength);
    }
  };

  // Similar handlers for frequency and energy...
}
The trick is keeping the three in sync without setting off an update loop: wavelength updates frequency, which updates energy, which updates wavelength again. Treating the selected wavelength as the single source of truth and deriving the rest from it avoids that.
Input Parsing and Validation
People type units every way you can imagine, so the parser has to handle unit suffixes and scientific notation:
export function parseWavelength(input) {
  const value = safeParseFloat(input);
  if (isNaN(value)) return NaN;

  const unit = input.toLowerCase().replace(/[0-9.\-+e\s]/g, '');

  switch (unit) {
    case 'nm': return value * 1e-9;
    case 'μm': case 'um': return value * 1e-6;
    case 'mm': return value * 1e-3;
    case 'cm': return value * 1e-2;
    case 'm': return value;
    case 'km': return value * 1e3;
    default: return value; // assume meters if no unit
  }
}
It accepts the common spellings, including both μm and um, and falls back to meters when there’s no unit rather than rejecting the input outright.
Educational Interface Patterns
Progressive Disclosure
The educational panel implements progressive disclosure patterns that reveal information based on user interaction and current context:
function SimpleEducationalPanel({ selectedWavelength }) {
  const region = getRegionByWavelength(selectedWavelength);

  if (!region) {
    return <div>Select a wavelength to explore its properties</div>;
  }

  return (
    <div className="educational-panel">
      <h3>{region.name}</h3>
      <p>{region.description}</p>

      <div className="applications">
        <h4>Applications:</h4>
        <ul>
          {region.applications.map((app, index) => (
            <li key={index}>{app}</li>
          ))}
        </ul>
      </div>

      <div className="examples">
        <h4>Real-world Examples:</h4>
        <ul>
          {region.examples.map((example, index) => (
            <li key={index}>{example}</li>
          ))}
        </ul>
      </div>
    </div>
  );
}
The panel only shows what’s relevant to the current selection. Pick a wavelength and you get that region’s description, applications, and examples. Pick nothing and you get a short prompt instead of an empty box.
Visual Feedback Systems
The spectrum visualization provides immediate visual feedback through color coding, positioning, and scale indicators:
function SimpleSpectrum({ selectedWavelength, onWavelengthChange }) {
  const position = getLogPosition(selectedWavelength, 1e-15, 1e4);
  const region = getRegionByWavelength(selectedWavelength);

  return (
    <div className="spectrum-container">
      <svg width="100%" height="100">
        {SPECTRUM_REGIONS.map(region => (
          <rect
            key={region.id}
            x={getLogPosition(region.wavelengthMin, 1e-15, 1e4) * 100 + '%'}
            width={(getLogPosition(region.wavelengthMax, 1e-15, 1e4) -
                   getLogPosition(region.wavelengthMin, 1e-15, 1e4)) * 100 + '%'}
            height="100%"
            fill={region.color}
            onClick={() => onWavelengthChange(
              (region.wavelengthMin + region.wavelengthMax) / 2
            )}
          />
        ))}

        <line
          x1={position * 100 + '%'}
          x2={position * 100 + '%'}
          y1="0"
          y2="100%"
          stroke="black"
          strokeWidth="2"
        />
      </svg>
    </div>
  );
}
Each region is a colored rectangle placed by its log position, with a vertical line marking the current selection. Clicking a region jumps to its midpoint, which is enough for browsing; the conversion panel is there when you need an exact value.
Testing Strategies for Scientific Applications
Physics Calculation Validation
Tests here check two things at once: that the code runs and that the answer matches the physics. I pin a few known conversions and assert against them within a tolerance:
export function testPhysicsCalculations() {
  const tests = [
    {
      name: 'Visible light wavelength to frequency',
      wavelength: 550e-9, // Green light
      expectedFrequency: 5.45e14, // Hz
      tolerance: 1e12
    },
    {
      name: 'X-ray energy calculation',
      wavelength: 1e-10, // 0.1 nm
      expectedEnergy: 12400, // eV
      tolerance: 100
    }
  ];

  tests.forEach(test => {
    const frequency = wavelengthToFrequency(test.wavelength);
    const energy = wavelengthToEnergyEV(test.wavelength);

    assert(
      Math.abs(frequency - test.expectedFrequency) < test.tolerance,
      `Frequency calculation failed for ${test.name}`
    );
  });
}
Green light at 550 nm should come out near 5.45e14 Hz, and a 0.1 nm X-ray should land around 12400 eV. If either drifts, something in the constants or the math broke, and the test says so before a user ever sees it.
Performance Optimization for Large-Scale Data
Efficient Range Calculations
Showing a wavelength means picking a unit so the number reads cleanly instead of as a wall of exponent. The formatter switches units by magnitude:
export function formatWavelength(wavelength) {
  if (!isFinite(wavelength) || wavelength <= 0) {
    return 'Invalid wavelength';
  }

  if (wavelength >= 1e-3) {
    return wavelength >= 1 ?
      `${wavelength.toExponential(2)} m` :
      `${(wavelength * 1000).toFixed(2)} mm`;
  } else if (wavelength >= 1e-6) {
    return `${(wavelength * 1e6).toFixed(2)} μm`;
  } else if (wavelength >= 1e-9) {
    return `${(wavelength * 1e9).toFixed(2)} nm`;
  } else {
    return `${wavelength.toExponential(2)} m`;
  }
}
Millimeter-scale values read in mm, micron-scale in μm, and nanometer-scale in nm, with exponential notation held back for the extremes.
Deployment and Distribution Patterns
Automated GitHub Pages Deployment
Deployment is a GitHub Actions workflow that builds and pushes to GitHub Pages on every commit to main:
name: Deploy to GitHub Pages
on:
  push:
    branches: [ main ]
jobs:
  deploy:
    runs-on: ubuntu-latest
    steps:
      - uses: actions/checkout@v3
      - name: Setup Node.js
        uses: actions/setup-node@v3
        with:
          node-version: '18'
      - name: Install dependencies
        run: npm install
      - name: Build
        run: npm run build
      - name: Deploy to GitHub Pages
        uses: peaceiris/actions-gh-pages@v3
        with:
          github_token: ${{ secrets.GITHUB_TOKEN }}
          publish_dir: ./dist
Push to main and the live site updates itself. Nothing to babysit.
Future Directions in Scientific Web Applications
A few things I’d like to add when I get back to it:
- Wiring in a physics engine so the visuals can move instead of sitting still.
- Shared sessions, so two people can explore and annotate the same view.
- Content that adapts to what a learner has already looked at.
- Real parity on mobile and VR, not a shrunk-down desktop layout.
None of the groundwork here is exotic. The value was in the discipline: exact constants, log scaling done once and reused, tests that assert physics and not just code paths. That combination carries over to any tool where the numbers have to be right.
Getting Started
Want to explore the electromagnetic spectrum yourself? The application is available at cameronrye.github.io/electromagnetic-spectrum-explorer, and the complete source code can be found at github.com/cameronrye/electromagnetic-spectrum-explorer.
That’s the whole thing. The math is exact, the layout is honest about scale, and it all runs in the browser.
The full source, including everything shown here, is on GitHub.
Keep Reading
Companion projectElectromagnetic Spectrum Explorer
An interactive web application for exploring the electromagnetic spectrum from radio waves to gamma rays, with real-time visualization, unit conversion, and educational content for each region.
View this project →Uzumaki: One Spiral Engine, Two Native Platforms
Ten spiral algorithms, six deployment targets: how I kept React and SwiftUI renders of Uzumaki mathematically identical across web and Apple platforms.
Building an Interactive Circle of Fifths: Music Theory Meets Web Audio
I built an interactive Circle of Fifths that plays what it shows. Web Audio synthesis turns a centuries-old theory diagram into something you can hear.
Building Zero Crust: Distributed State Management in Electron
Two displays, one source of truth: how I built a dual-head POS simulator in Electron with centralized state, broadcast sync, and locked-down IPC.
Subscribe
Was this helpful?
Discuss
Ask can help explain concepts, provide context, or point you to related content.